


Categorization:Harness Component
In high-speed electronic equipment, extremely thin coaxial cables bear the task of high-speed digital signal transmission. It is difficult to accurately judge the actual high-speed performance of a cable bundle simply by its wire diameter, length, or connector appearance. The Insertion Loss (IL) curve can more intuitively reflect the energy attenuation of the signal as it passes through the cable bundle with frequency changes. Generally speaking, under the same test conditions, the same cable length, and the same impedance system, the lower the insertion loss curve, the smaller the loss during signal transmission; with the increase in frequency, the conductor loss, dielectric loss of the cable, and the loss brought by the connectors and termination structures will usually increase further. Therefore, when engineers evaluate extremely thin coaxial cables, they should focus on the overall trend of the insertion loss curve, the loss level within the target operating frequency band, and whether there are any abnormal abrupt changes in the curve. Taking the I-PEX 82689-100B-01-D as an example, this product is a CABLINE®-VS 30P thin coaxial cable bundle, using 30 AWG#40, 50Ω Micro-Coaxial Cables, with a cable length of 300±5mm, and the connector model used at the cable material end is 20454-230T. Therefore, when performing high-speed performance verification, actual S-parameter tests should be carried out for such specific structures, and performance should not be judged solely based on theoretical wire diameter.
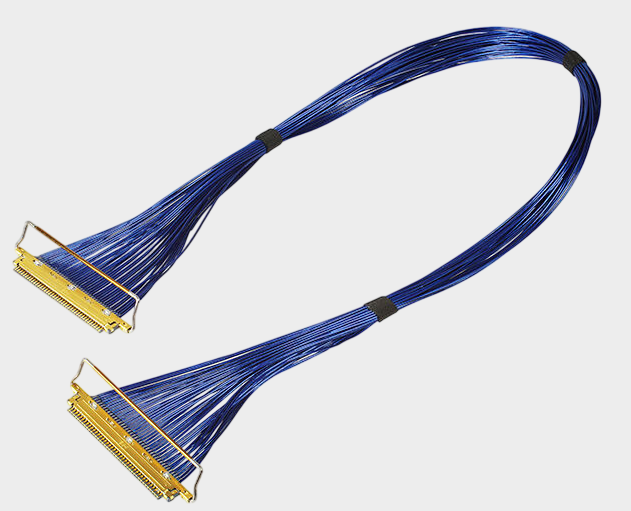
When observing the insertion loss curve, it is first necessary to clarify what the horizontal and vertical axes represent. The horizontal axis is usually frequency, with units being MHz or GHz; the vertical axis is generally expressed in dB, with values usually being negative, such as -1dB, -3dB, -6dB, etc. For the same test structure, the closer the curve is to 0dB within the target frequency range, it usually indicates less signal attenuation. If the curve smoothly decreases with increasing frequency, it is usually understood that cable loss gradually increases with the frequency increase; if there is a sudden dip, fluctuation, or abnormal inflection point at a certain frequency, it is necessary to further inspect factors such as impedance discontinuity, connector termination, welding area, cable structure changes, or testing fixture. For the 300MM long I-PEX 82689-100B-01-D, engineers should pay particular attention to the impact of "cable length" on insertion loss, because in the case of the same cable specification and structure, the increased cable length usually results in greater cumulative transmission loss. Therefore, the insertion loss results of a 100MM cable cannot be directly equated to those of a 300MM cable, and it is even more inappropriate to simply compare two insertion loss curves under different test frequency bands, different fixtures, and different calibration conditions.
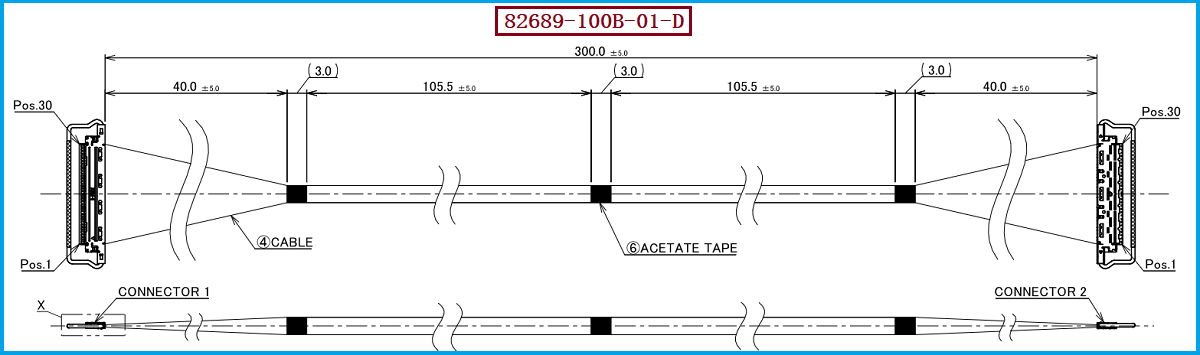
For engineers, determining whether a very thin coaxial cable assembly can replace the original product cannot be solely based on "whether the insertion loss value is low or not." Instead, it should focus on confirming the curve trend, maximum insertion loss, impedance consistency, and the repeatability between different batches within the target frequency range, and make a comprehensive judgment by combining signal integrity indicators such as return loss, crosstalk, and eye diagrams. Especially for high-speed interface applications, a good insertion loss performance at a certain frequency point does not necessarily mean the entire working frequency range meets the requirements. For purchasing personnel, it should require the alternative supplier to provide test data comparable to the original product and confirm the test conditions, including cable length, connector type, wire specification, test frequency, test fixture, and calibration method. Taking I-PEX 82689-100B-01-D as an example, its key specifications include 30Pin, AWG#40, 50Ω, 300±5mm, 20454-230T, and 1-1 line position definition, these parameters should be used as the basic matching conditions for the alternative product; if the alternative solution can be assembled in terms of appearance but the insertion loss curve, impedance, or termination structure has changed significantly, it still needs to be verified by the actual equipment before it can be judged whether it is truly compatible.
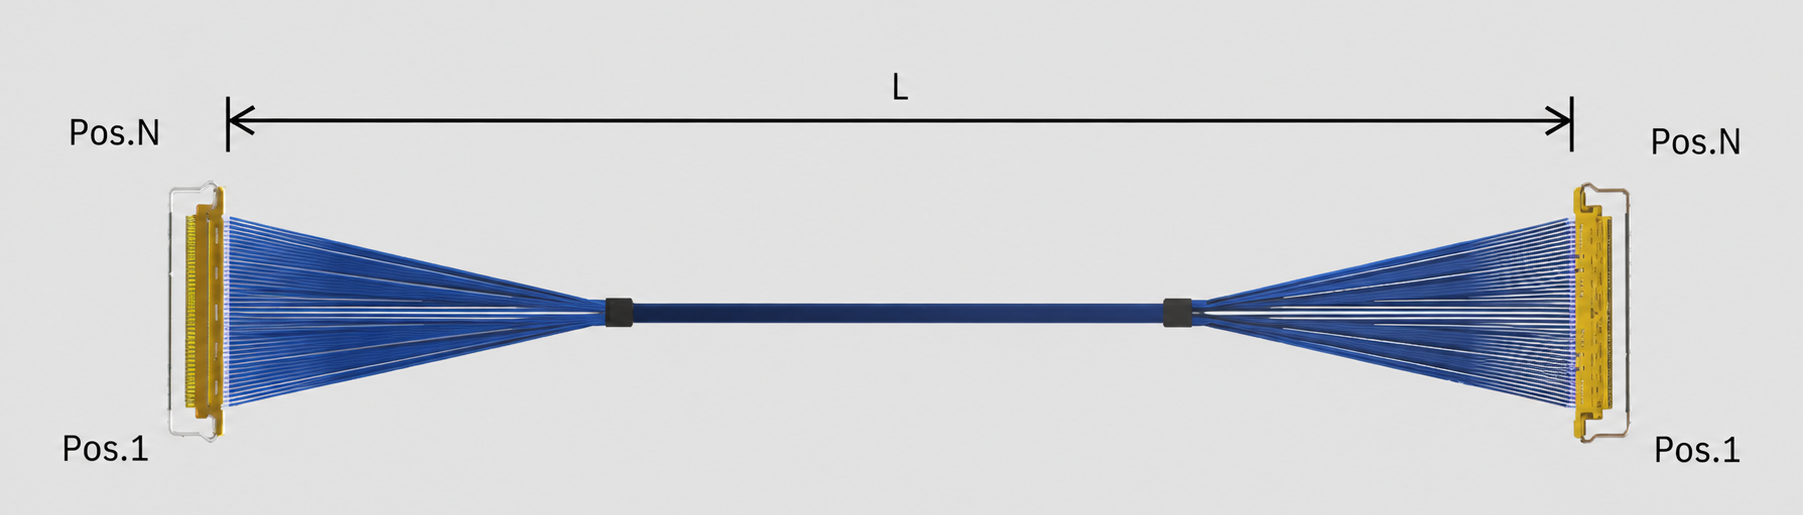
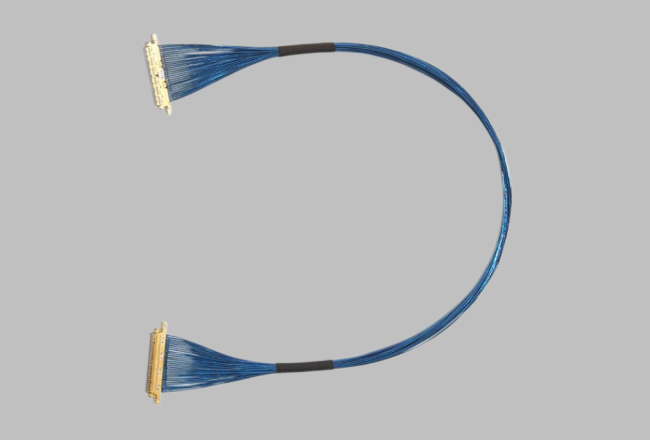
For engineering projects that require domestic substitution, it is recommended to first establish a complete specification correspondence table, taking I-PEX 82689-100B-01-D as the reference model, and focusing on key parameters such as the number of 30Pin, AWG#40 thin coaxial cable, 50Ω impedance, 300±5mm length, 1-1 wire position definition, and 20454-230T connector. Subsequently, conduct S-parameter tests on the substitute cable束 using test equipment such as VNA, focusing on analyzing insertion loss S21, return loss S11, and other data, and compare them with the original product within the target working frequency band. For the procurement side, it is recommended not to rely solely on the results of a single sample test for mass production, but also to pay attention to the consistency of batch products, connector assembly accuracy, cable length tolerance, termination technology, and production stability. Our company can provide I-PEX 82689-100B-01-D compatible substitute cable束 solutions, which can focus on the development and production of extremely thin coaxial cable束es around the 20454-230T connector, 30Pin, AWG#40, 50Ω, 300MM length, and 1-1 wire position definition, and can also verify the cable structure and transmission performance according to the actual high-speed signal requirements of the customer's equipment, providing more implementable domestic substitution solutions for engineers and procurement personnel.
“Without the consent or authorization of this site, no one shall reproduce, reprint, distribute, cite, change, broadcast or publish the content in whole or in part in any form, nor shall there be any other violation of the copyright of this site.